
|Articles|September 1, 2014
Increasing Plant Profitability
Author(s)TMI Staff & Contributors
Advertisement
CONTINUOUS PERFORMANCE EVALUATION CAN HAVE A MAJOR IMPACT ON THE BOTTOM LINE
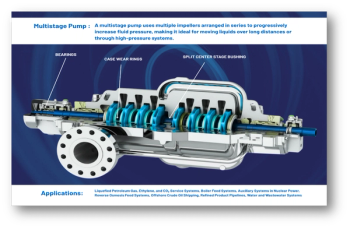
If you cannot measure something it is difficult to control. That is the basis of performance evaluation. It begins with original vendor-supplied data, which includes performance curves, operating conditions, power and efficiency curves and other information pertaining to the equipment. This forms the benchmark for the condition of any rotating machinery, such as a centrifugal pump.
Necessary is a plant monitoring system capable of showing real-time information as well as trending, managing, and monitoring complex plant processes. Such a system can be customized to interface with external applications, such as Microsoft Office, to present and evaluate data in a meaningful fashion. We leverage one such system, called PI Process Book, developed by OSI Soft, along with Excel, to capture, trend and evaluate centrifugal pump performance.
Feed water pumps
Boiler feed water (BFW) pumps supply feed water to systems that produce steam for the plant. This steam is used in various process operations, heating and in running turbomachinery including small and large steam turbines.
BFW pumps are also used in processes involving oil recovery via underground steam injection through steam-assisted gravity drainage (SAGD). Evaluating these pumps helps avoid unnecessary operational interruptions and shutdowns which lower cost, and increase uptime and profitability.
Table1: Head, Flow, Power and Efficency test data for BFW pump[/caption]
Figure1:H-Q curve for BFW pump[/caption]
The first step is to develop an Excel sheet with all relevant performance data (Table 1). The next step is to generate the appropriate graphs to monitor pump performance (Figure 1, 2 and 3). Once done, use the plant monitoring system (in this case PI Process Book) to capture and develop all process tags available in the database for the BFW pump.
It is important to capture tags relevant to a particular piece of equipment. In this case, X,Y vibration readings, suction, discharge pressure, flow, bearing temperature and speed. Note that many of the tags used in such software can be easily called into Microsoft Office in real time for a detailed data analysis. Flow, suction pressure, discharge pressure, calculated total dynamic head (TDH) and hydraulic power for the pump were imported into Excel for analysis and monitoring (Table 2).
Once accomplished, the next stage is to integrate Excel data with process data to analyze, monitor and take corrective action when necessary. Figures 1 and 2 show the HQ and power curves, respectively, which incorporate the pump TDH flow and pump hydraulic power.
This helps present pump operation relative to its actual operation during a performance test after manufacturing. It shows how far the pump has moved away from the operating point, as well as estimates of operating power losses.
Figure 3: Efficiency Curve for BFW pump[/caption]
Process and calculated data for BFW pump
Power vs flow rate of BFW pump[/caption]
Efficiency of a centrifugal pump is defined as the ratio of power out to power in. Pumps operating away from their best efficiency point (BEP) are not being used correctly. The causes are:
- Internal wear of mechanical components leading to recirculation
- Issues with pump bearings leading to high preload or over-lubrication
- Running pumps with throttled discharge valves
- In-correct pump selection for the application.
The bottom line
Pump inefficiency can be measured by life cycle cost (LCC) as follows:
LCC=Cic+Cin+Ce+Co+Cm+Cs +Cenv+Cd eq.(1)
Cic=Initial costs, purchase price (pump, system, pipe, auxiliary services)
Cin=Installation and commissioning cost
Ce=Energy costs (predicted cost of operating the system including driver)
Co=operation costs (labor cost of normal system supervision)
Cm=maintenance and repair costs (routine and predicted repairs)
Cs=downtime costs (loss of production)
Cenv = environmental costs
Cd=decommissioning/disposal costs
Ce consumption will usually dominate the equation. Therefore it is critical to maintain and run pumps efficiently. Assume the BFW pump is being run on a motor at a cost of $0.07495 per kwh.
The hydraulic power of the pump was computed using a modified version of eq. (3). The vendor curve in Fig 2. ( new pump shaft power for a given flow) was also used. It was determined that the pump was operating at an efficiency of 0.74. Now assuming a motor efficiency of 0.80, the power required for the system would be:
Equation (4) provides a power input requirement of 1,612 kW for this pump and the assumed motor. Assume $ 0.07495 /kWhr for energy cost, if this system were running throughout the year for 8,765 hours. The total approximated energy cost of running this pump is $1,059,427.
This gives an idea of how important it is to operate pumps close to their BEP and to monitor their condition to ensure that they do not waste energy. Calculating energy cost at different operating points can be automated in Excel.
It would be beneficial to develop such sheets for all plant machinery, integrating process data and storing it in a common database to measure equipment performance and subsequent impact on energy costs. A proactive approach such as this will impact the bottom line.
References
1. The Hydraulic Institute website - www.pumps.org
2. Perry's Chemical Engineers' Handbook, Eighth
Edition
Written by: Umeet Bhachu, P.Eng, CMRP, a registered engineer in the province of Alberta and is working as a rotating equipment engineer for the Canadian Natural Resources Ltd refinery. He can be reached at (780)713-5196 or [email protected]
Advertisement
Related Content
Advertisement

Advertisement
Advertisement
Trending on Turbomachinery Magazine
1
Hawaiian Electric Orders Six GE Vernova LM6000VELOX Units to Repower Waiau Plant
2
GE Vernova Expands Niskayuna Research Campus With $110M Investment in Energy Tech
3
Entergy, MHI Group MOU Targets 50% CCS Cost Reduction with Integrated GTCC Solution
4
Baker Hughes Closes Chart Industries Deal, Adding $4.3B Industrial Segment
5