When It Surges, It Shakes
WHY IS ELEVATED VIBRATION DURING SURGE OFTEN ABSENT FROM THE DATA COLLECTED BY THE ONLINE VIBRATION MONITORING SOFTWARE?
Surge and rotating stall in centrifugal and axial compressors are well-understood aerodynamic phenomena, documented in literature. The mechanical vibration, both radial and axial, that occurs during surge and rotating stall has likewise been documented.
Depending on where vibration sensors are mounted, and the compressor stage at which stall and surge may be occurring, it is possible to observe a simultaneous rise in vibration. For example, 14 separate surge tests conducted across seven separate compressor trains showed a 100% correlation between vibration and surge, observed by almost every vibration sensor on the machine (Table 1).
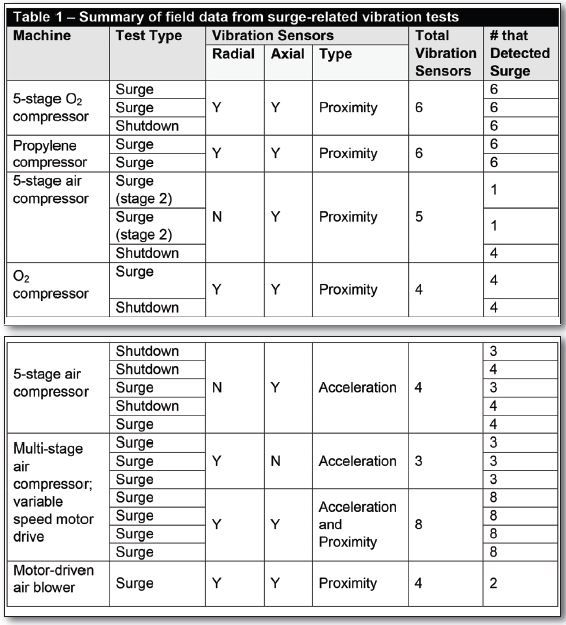
Yet if vibration is often such a good precursor or corroborator of surge, why is it often missing in action when the vibration condition monitoring software is consulted following a real or suspected surge event? To understand why this happens, and what can be done to remedy it, we must first look at how vibration data collection are triggered in most online systems today.
Online systems, by design, do not store everything. If they did, even a modest number of vibration sensors would incur terabytes of data storage per month. A reasonable rule of thumb for mechanical vibration is that it uses about the same sample rates and bandwidth as the audible spectrum for high-fidelity sound.
Consider that a one-hour audio CD consumes about 600 MB for two channels (stereo), or about 400 GB for one month. This is roughly the same GB consumption as a single X-Y pair of vibration sensors. As even a modest compressor train has a dozen or more vibration sensors, the implications of storing everything and moving it over the network infrastructures available in a typical industrial plant render it impractical.
In addition to these physical limitations, there are also practical considerations. Out of a typical 720 hours in a month, bona-fide machinery problems manifesting as abnormal vibration patterns may occur for only several minutes, if at all. Thus, the ratio of interesting data to uninteresting data is usually exceedingly small. Sifting through 720 hours of vibration data to find the blip of interest can be daunting.
To deal with these issues, the most commonly encountered systems in the field for continuous vibration condition monitoring established three basic modes of dynamic (i.e., waveform) data collection:
Delta-Time (Δt): Data collected at evenly- spaced, preset time intervals
Delta-RPM (ΔRPM): Data collected at evenly-spaced, preset rpm intervals, as the machine was started or stopped
Alarm Buffer: Data collected before, during, and after a time window surrounding an alarm (usually, hardware alarms rather than software alarms). The data window is typically 10 minutes before an alarm and 1- 2 minutes after an alarm at moderate resolution, and only the immediate 30 seconds preceding an alarm at high resolution.
So-called static data (amplitude, phase, gap or bias voltage, and so on.) is generally collected more frequently than dynamic data, but still adheres to the above three regimes. These systems have evolved little since their inception in terms of the way they recognize and trigger the collection of interesting data.
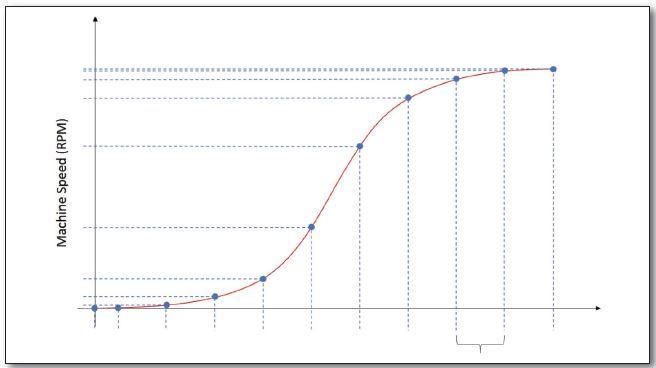
Figure 1: Delta-time data collection stores vibration samples at evenly spaced
increments of time. It is generally used only during steady-state (constant speed)
conditions because it under collects data when machine speed is changing rapidly[/caption]
In Δt mode, data is collected at evenly spaced time intervals as shown in Figure 1. Its primary purpose is to establish trends with sufficient resolution such that slowly developing changes can be seen. The intervals shown are for illustration purposes only. Actual Δt intervals are not usually in seconds (20 minutes to 2 hours are typical). Only a minimal set of attributes relating to the data are stored, such as maximum amplitude, minimum amplitude, and average amplitude during the time interval.
This method relies on a rolling buffer. It maintains a relatively high-resolution record of the last 10 minutes of vibration data. When no alarms occur, the oldest data is continuously overwritten by the new data. When an alarm occurs, the data in this buffer is frozen and saved, much as one might capture an intruder on surveillance camera by sensing when glass breaks on the front door and reviewing the video footage leading up to, during, and several minutes after the glass breakage.
Vibration systems work in similar fashion by waiting for a hardware alarm to occur from excessive vibration and saving about ten minutes of data leading up to the alarm, at the moment of alarm, and approximately two minutes after the alarm (Figure 2).
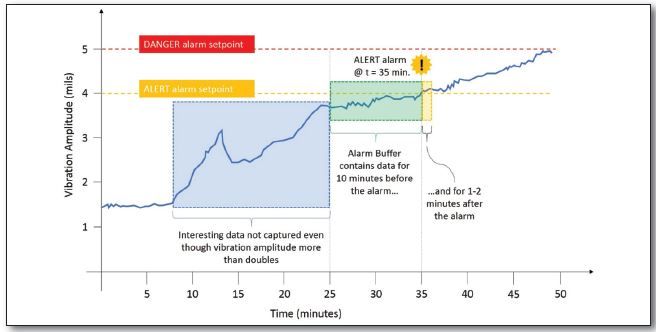
Figure 2: Alarm buffer data collection stores vibration data for a limited period prior
to and after the alarm, but can miss significant changes in data that occur beneath
the alarm setpoint. The data shown in the blue shaded area would be observable
only as a limited resolution trend[/caption]
However, there are several ways that data can fail to be captured. Most users only configure hardware alarms due to the tedium involved in tailoring software settings for each vibration point and parameter.
Two levels of hardware alarms (high and high-high) are typically present, but are generally set conservatively in order to not trip machine trains based on small changes in vibration.
It is not unusual for vibration levels in normal operation to be only 10% of alarm levels, such as a compressor set to alarm at 4 mils and trip at 5 mils of radial vibration, but running normally at 0.5 mils. In such a case, vibration amplitudes would need to increase by a factor of 8 for an alert and a factor of 10 for a trip, either of which would trigger a hardware alarm and freeze the corresponding alarm buffer.
Many vibration events do not incur sufficient change to trigger a hardware alarm. Surge-related vibration often falls into this category: significant enough to be of interest, but not of sufficient amplitude to trigger a hardware alarm or machine trip.
Another factor contributing to missed data is that although surge-related vibration often manifests as pronounced axial vibration rather than solely radial vibration, the thrust bearing monitoring on most machines is set to recognize only gross axial position changes, not axial vibration. Axial position monitors contain filtering that ignores the axial vibration component and responds only to the average axial position.
The alarm buffer method, therefore, often provides no useful data in a surge event because no relevant hardware alarms have been triggered. Trends may show elevated vibration levels, but waveform data is missing (the very data needed to distinguish surge-related vibration from other sources with similar characteristics and sub-synchronous frequency content such as axial and radial rubs, oil whirl, oil whip, and anything that causes re-excitation of the first balance resonance).
Delta-RPM collection
This mode collects data at preset rpm intervals. For example, the user may configure the system to collect a waveform (dynamic data) at 100 rpm intervals during a startup.
For a machine running at 6,000 rpm, a total of 60 waveforms would be collected during a startup. Static data is often collected at a 10:1 ratio, or in this case, once every 10 RPMs. Thus transient data is collected at relatively high resolution and when a surge-related event occurs during a startup or coast-down on machines for which ΔRPM data capture has been configured, it is usually caught.
Unfortunately, the times when surge is most often of interest are not during transient run-up or run-down conditions, but during steady-state speed operation when other process changes are occurring. These changes can lead to surge and may not be fully characterized in the surge-control algorithm, when supplemental vibration data to confirm a surge event can be most beneficial.
Although the alarm-event capture and transient-data capture methods could conceivably provide data with sufficient resolution to see the surge event in high fidelity, they are often not invoked during a surge event as described above.
Those familiar with the concept of dead bands in process data historians understand that it is not necessary to store every data point in a trend when the data is unchanging. One can simply store two points and draw a straight line between them. Only when data varies is it necessary to store another trend point.
With process variables, only a single attribute of the data (amplitude) is examined. A dead band is established around the process variable such that its change must fall outside of this dead band to be recorded. Otherwise, the data is assumed to be unchanging. Such methods are routinely employed in data historians.
Unlike process variables, vibration data cannot be adequately characterized by amplitude alone. Instead, it is a complex waveform that contains multiple frequency components, subtle changes in period when speed is changing, changes in average DC offset, and changes in the shape of the orbit when X-Y probes are present in addition to the gross changes in overall vibration amplitude.
As the vibration system is recording these waveform attributes, the dead-band concept can be applied to waveforms. A baseline is stored along with sufficient attributes such as phase, amplitude, frequency content, gap voltage, period (speed) and the energy or amplitude within specific frequency bands.
Once a baseline waveform has been stored for every sensor, it is unnecessary to store each subsequent waveform. It is sufficient to compare every waveform to the baseline and discard if nothing has changed. Instead of hardware alarms, it relies on adaptive change percentages. The system can automatically identify interesting data and store data under changing speed conditions.
When it Shakes, it’s Saved
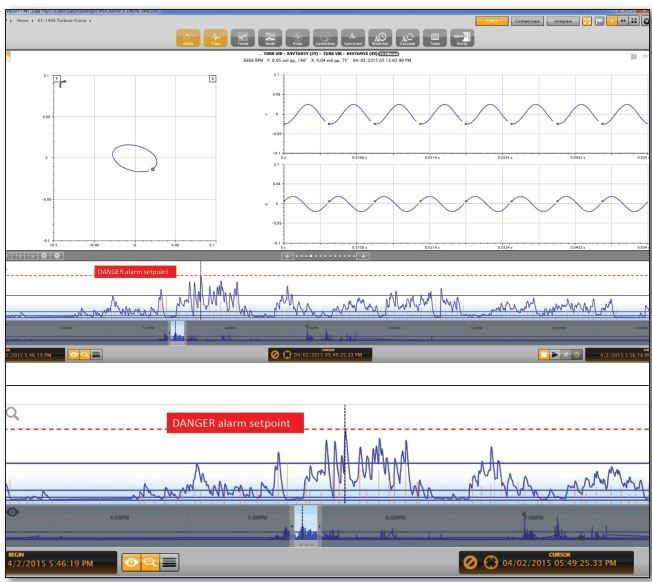
Figure 4 (TOP): Data collection based on “interestingness” is able to detect subtle changes in the waveform. Timeline at the bottom of the screen shows many meaningful “blips” in trend lines during a 10-minute segment of data, but none exceeded the alarm setpoint (shown by the red dashed line) and would not have been collected by systems relying on hardware (or software) alarm buffers. Orange vertical lines (Figure 5) show where waveforms were captured based on data interestingness. Data acquisition functions in this mode any time sufficient change occurs Figure 5 (BOTTOM): Enlarged portion of timeline from Figure 4 showing orange vertical lines in greater detail. Each one marks the instant in time where a waveform was stored and the height of each orange line is proportional to the waveform’s “interestingness” (i.e., its i-value) relative to the baseline waveform[/caption]
The latter approach makes use of the ivalue algorithm (i for interestingness) and has been present in a machinery protection and condition monitoring system developed in 2013. The data in Figures 4 and 5 are taken from a compressor train operating in a North American refinery. The algorithm can be adjusted as required, but work well for the majority of turbomachinery under factory settings. This technology helps ensure that when it shakes, it’s saved.
While part of the challenge is to save the data at the right times, a second challenge is to bring the data from disparate systems together. The logical place to do this is in the data historian, making it the single repository and allowing process, mechanical, thermodynamic and aerodynamic data to be correlated.
This eliminates the need for standalone data acquisition systems for vibration data, compressor performance data and surge analytics. Fortunately, the state-of-the-art has advanced sufficiently to allow the use of an off-the-shelf process historian. The OSIsoft PI System, for example, has the needed performance and data storage capabilities. This establishes a common repository and eliminates standalone information silos (Figure 6).
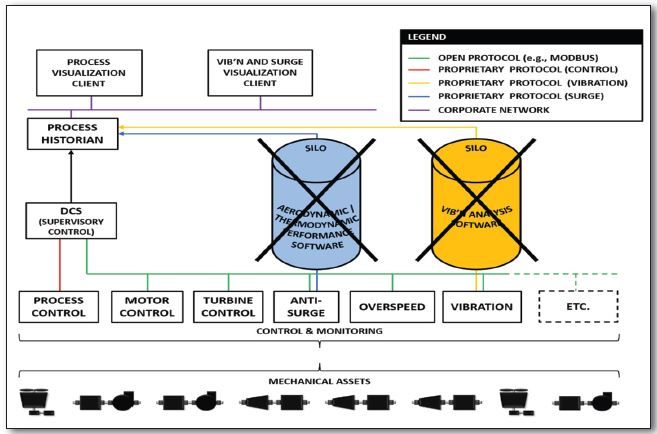
Figure 6: By using the process historian, IT infrastructure can be eliminated and all of the
relevant data in the plant can reside in a single system of record. Data correlation between
disparate sources allows for faster, more effective analysis and root cause determination[/caption]
Written by:

Shun Yoshida is Product Manager at Compressor Controls Corporation (CCC), which has specialized in turbomachinery and compressor controls for more than 40 years. CCC offers consultation on advanced controls.

Steve Sabin is Product Manager at Setpoint Vibration. The company’s Setpoint CMS software provides value data capture as described in this article and uses the OSIsoft PI System software as its real-time database. www.setpointvibration.com
