World Market Outlook
INDUSTRIAL GAS TURBINES FLEX THEIR MUSCLES; MAINTENANCE ROUTINES TARGET FAST-START REQUIREMENTS AND LONGER LIFECYCLES
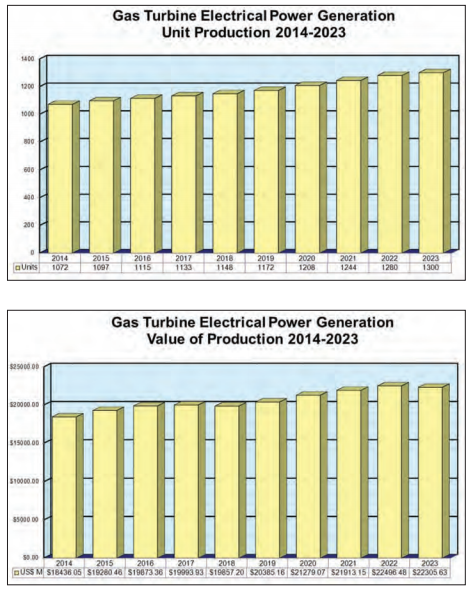
Forecast International predicts sales of 1,072 gas turbines for electrical power production in 2014, increasing steadily to 1,300 units by 2023. The value of production will be $18.4 billion in 2014, rising to $22.3 billion by 2023.
Annual growth in global gas turbine unit sales will drop from 2.3% in 2014 to 1.3% in 2017. A rebound of 2% is likely in 2018, maintaining 3% over the next three years. Value of production is expected to grow an average of 1.7% over the next ten years, with the least growth again in the span from 2016 to 2018.
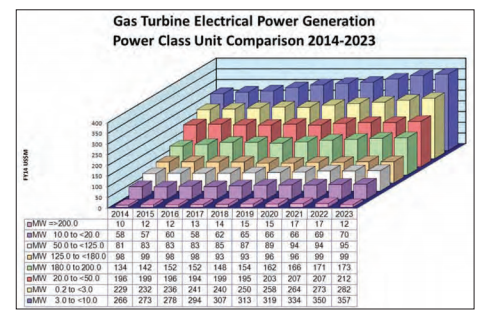
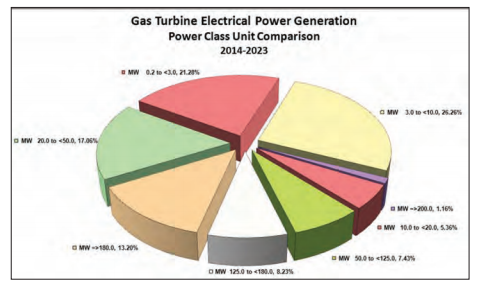
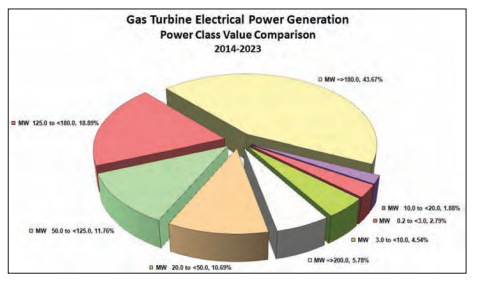
Nearly 60% of the turbines produced in the coming decade will be of an output below 50 MW, corresponding to the needs of developing countries, distributed generation and peaking power requirements. These units in simple cycle are also likely to find use in conjunction with renewable energy power plants, helping them keep their generating profile level.
Larger output gas turbine machines will typically be installed in combined cycle service for power generation, industrial cogeneration or combined heat and power applications.
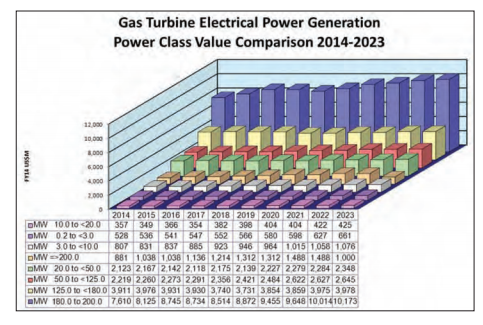
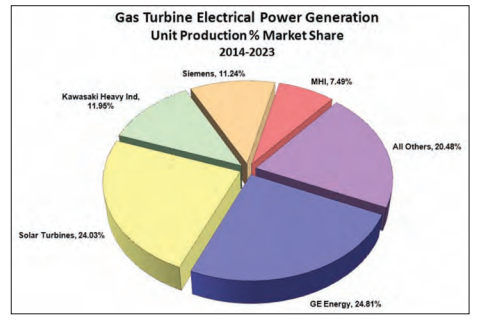
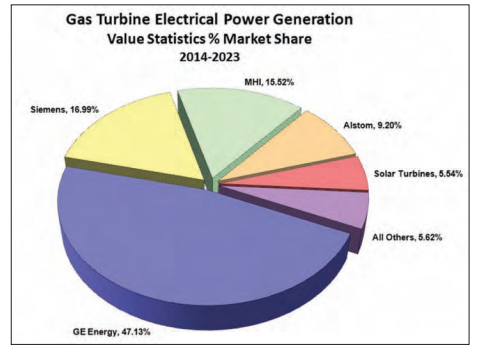
In the coming decade, we project that 11,769 gas turbines will be built for electrical power generation, having a value of production in excess of $205 billion (in current U.S. calendar-year dollars). General Electric is projected to again be the leading market player in terms of value of production, with a 47% share. In terms of the number of machines manufactured, GE narrowly overtook Caterpillar’s Solar Turbines in San Diego, California, with both scoring over 24%.
Gas turbine dominance
As technologies in induced hydraulic fracturing and horizontal drilling have enabled the U.S. to recover record amounts of fuel oil and natural gas from oil shale deposits, such as the Marcellus and Eagle Ford plays, gas turbines have been involved every step of the way. From Capstone Microturbines, Opra, Kawasaki and Solar Turbines, through PW Power Systems and Rolls-Royce aeroderivative machines up to the frame machines from GE, Siemens, Alstom and Mitsubishi, gas turbines are used for mechanical drive and power generation throughout the process.
The U.S. will soon outstrip Russia and Saudi Arabia as the leading producer of petroleum and natural gas in the world, benefiting from the ready supply of economical domestic fuel for power generation. Gas turbines in combined cycle applications are the least polluting and most economical way to convert that fuel to electricity.
Although coal is the most abundant fuel source in North America and still the leader in worldwide power generation, current trends continue to show that combustion turbines fueled by natural gas, especially in combined cycle applications, are for now the logical choice for electrical power generation. Among the many factors which contribute to this are the machine’s low emissions, economy, flexibility, expedient construction and fast response time.
Combined cycle power plants use the hot exhaust from a gas turbine to generate steam in a waste heat recovery boiler, which in turn drives a steam turbine. Both turbines transfer their kinetic energy to generators that produce electricity. The combined cycle system significantly increases the electrical energy derived from fuel, which is environmentally sound and reduces fuel expense.
Combined cycle plants also boast a high level of efficiency and operational flexibility. These combustion turbines achieve quick run-up times, fast load response and provide power flexibly and quickly in a market with a high share of renewable energy sources. At the same time, enhanced technology lowers emissions during the start-up process.
The 300 MW Lodi Energy Center in Lodi, CA, features the Siemens SCC6- 5000F Flex-Plant combined cycle power island and has an efficiency of more than 57%. The plant’s fast run-up time enables it to feed 200 MW of electric power into the grid within 30 minutes, which makes it good for balancing energy production fluctuations at wind farms and solar power stations.
The current administration plans to meet 25% of the country’s electricity requirement with energy from renewable sources by 2025. Combined cycle plants fulfill critical requirements by offseting the fluctuating electricity output at power plants that use renewable energy sources, and by replacing older coal-fired plants combined cycle facilities substantially reducing CO2 emissions.
Tennessee Valley Authority (TVA), one of the larger U.S. public utilities, has decided to idle several coal plants in favor of combined cycle generation. Near the middle of November 2013, the board of directors voted to change TVA’s power generating profile to keep pace with changing economic and regulatory conditions.
The board’s plan will retire eight coal units at three plant sites with more than 3,000 MW of combined generating capacity. The retirements affect all five coal units at the Colbert Fossil Plant in Tuscumbia, AL; one of two operating coal units at Widows Creek Fossil Plant in Stevenson, AL, and two of three coal units at the Paradise Fossil Plant near Central City, KY. Paradise Unit 3, one of TVA’s largest coal units, will continue to operate.
TVA has conducted detailed analyses including an environmental assessment to review options for meeting stricter air quality regulations at the Paradise plant, including installing additional emission controls on Units 1 and 2, building a new gas-fired generating plant at the site, or taking no action. Based on that review, the board has approved the construction of a gas-fired combined cycle plant at Paradise. This will result in an investment of some $1 billion at the site. The two coal units will be retired when the gas plant is available.
The new plan moves TVA toward a more diversified generation fleet of about 40% nuclear, 20% coal, 20% gas and 20% hydro, renewables and energy efficiency. This portfolio will help TVA manage load growth and provide maximum resilience.
World economic outlook
As the world recovers from the effects of the 2008 to 2009 global recession, many unresolved economic issues add to the uncertainty associated with long-term forecasting of world energy markets. There is wide variation in the economic performance of various countries and regions around the world. Among the more established Organization for Economic Cooperation and Development (OECD) regions, the pace of growth varies but generally is slow in comparison with the emerging economies of the nonOECD regions.
In the U.S. and Europe, short- and long-term debt issues remain largely unresolved and are key sources of uncertainty for future growth. Economic recovery in the U.S. has been weaker than the recoveries from past recessions, although some expansion is occurring.
In contrast, many European countries fell back into recession in 2012, and the region’s economic performance has continued to lag. Japan, whose economy had been sluggish before the devastating earthquake in March 2011, is recovering from its third recession in three years. Questions about the timing and extent of a return to operation for Japan’s nuclear power generators compound the uncertainty surrounding its energy outlook.
In contrast to the OECD nations, developing non-OECD economies, particularly in Asia, have led the global recovery from the 2008-2009 recession. China and India have been among the world’s fastest growing economies for the past two decades.
From 1990 to 2010, China’s economy expanded by an average of 10.4% per year and India’s by 6.4% per year. Although their economic growth remained strong through the global recession, both slowed in 2012 to rates much lower than analysts had predicted at the start of the year. In 2012, real GDP in China increased by 7.2%, its lowest annual growth rate in 20 years. India’s real GDP growth slowed to 5.5%.
The world’s real gross domestic product is projected to rise by an average of 3.6% per year from 2010 to 2040. The fastest rates of growth are projected for the emerging regions, where combined GDP will increase by 4.7% per year.
In the developed regions, GDP will grow at 2.1% per year over the projection, owing to more mature economies and slow or declining population growth. The surge in emerging nations will drive the fastpaced growth in future energy consumption projected for these regions.
The U.S. Energy Information Administration forecasts a 93% increase in world net electricity generation , from 20.2 trillion kilowatt-hours (kWh) in 2010 to 39.0 trillion kWh in 2040. In general, the growth of electricity demand in the northern hemisphere, where electricity markets are well established and consumption patterns are mature, is slower than in developing regions, where at present many people do not have access to electricity. Total net electricity generation in developing countries will increase by an average of 3.1% per year in the EIA reference case, led by non-OECD Asia (including China and India), where annual increases average 3.6% from 2010 to 2040. In contrast, total net generation in the OECD nations will grow by an average of 1.1% per year from 2010 to 2040.
In many parts of the world, concerns about security of energy supplies and the environmental consequences of greenhouse gas emissions have encouraged government policies that support a projected increase in renewable energy sources. As a result, renewable energy sources are the fastest growing sources of electricity generation in the EIA forecast, at 2.8% per year from 2010 to 2040. After renewable generation, natural gas and nuclear power are the next fastest growing sources of generation, each increasing by 2.5% per year.
Wind and solar
The intermittence of wind and solar energy, in particular, can inhibit the economic competitiveness of those resources, as they are not necessarily available when they would be of greatest value to the system. However, improving battery storage technology and dispersing wind and solar generating facilities over wide geographic areas could help to mitigate some of the problems associated with intermittency. In the interim gas turbine plants in the quickly dispatched simple cycle arrangement or more efficient combined cycle plan will continue to be the most efficient alternative.
About 65% of the existing natural gas capacity added since 1980 is for combinedcycle units. As a whole, average use of the U.S. fleet of natural gas combined-cycle plants has been increasing. Other recent natural gas capacity additions are primarily simple cycle combustion turbines, typically used as peaking units.
Capacity factors for the nation’s fleet of natural gas combined-cycle power plants have increased steadily since 2005. Increased use of these plants means that facilities that previously served peaking or more often intermediate load needs now contribute more significantly to base load electrical needs.
The average use of natural gas combinedcycle power plants has also increased across hours of the day. Between 2005 and 2010 average capacity factors for natural gas plant operations between 10 p.m. and 6 a.m. rose from 26% to 32%. For peak hours — from 6:00 a.m. to 10:00 p.m. — capacity factors averaged about 50% on a national basis in 2010 compared to about 40% in 2005.
Increasing domestic supply of natural gas and lower natural gas prices, together with the high efficiency of combinedcycle power plants, have contributed to their increased use. Our projection is that by the time ready gas fuel supplies decrease and gas prices begin to rise, coal and biomass gasification may well rise to the forefront, still using gas turbines in IGCC configurations.
MRO upswing
With a growing fleet of combustion turbines of high quality, many units are outperforming their original estimated life cycles, and the market for Maintenance, Repair and Overhaul (MRO) is increasing. Another factor that shortens mean time between overhauls is the fact that the fast response times of these machines leads to their application in peaking and cycling service, adding to the number of starts and thermal cycles they undergo. These factors tend to increase the demands for maintenance. Our estimate is that MRO for industrial and marine turbines will approach $8 billion in 2014 and nearly double over the next decade.
Currently the major original equipment manufacturers (OEMs) and several independent third-party companies all offer long term service agreements and perform overhauls on most of the popular machine designations available. Several companies that previously specialized in aviation turbines are starting to make forays into the industrial and marine turbine MRO markets.
For major outages involving overhauls or re-blading, all of the OEMs and third-party companies have experienced teams that specialize in these services. Many of the smaller turbines can be swapped out quickly and remanufactured, to minimize down time, but the larger aero-derivative and frame machines are typically rebuilt on-site.
Owners tend to form user groups for specific designations which allow them to pool their knowledge and resources. Typically the operations and maintenance personnel assigned to a site are responsible for minor routine maintenance, and the day-to day operations.
Personnel requirements for combined cycle plants are a tenth of what they would be for a comparable coal plant, and some simple cycle plants are monitored remotely from a central location, with no dedicated personnel at the site — particularly smaller machines providing power and mechanical drive to pumps and compressors on pipelines.
Aging workforce
As the workforce ages and more senior operators and experienced managers retire, the most likely source of O&M talent is from aviation mechanics and operators from military marine propulsion turbine service. Though labor is actually a small part of a plant’s annual budget, where 70% is typically fuel costs, it is important to recruit, train and retain quality operators.
Most generating contracts impose severe penalties for non-availability and unplanned outages, the majority of which can be avoided by proper operation and maintenance. Too often maintenance schemes are seen to slide from preventive maintenance plans to corrective maintenance and then operational maintenance, in a short-sighted desire to cut expenses.
Preventive maintenance is proactive, performing vibration analysis on operating equipment, testing lubricating oil and similar quality assurance programs. As the existing fleet of turbines matures they will only achieve optimum usefulness if they are operated within design parameters and skillfully maintained.